Layout Analysis Module User Guide
1. Overview
Layout analysis is a crucial component in document parsing systems. Its goal is to parse the overall layout of a document, accurately detecting various elements it contains (such as text paragraphs, headings, images, tables, formulas, etc.), and restoring the correct reading order of these elements. The performance of this module directly impacts the overall accuracy and usability of the document parsing system.
2. Supported Model List
Currently, this module only supports the PP-DocLayoutV2 model. Structurally, PP-DocLayoutV2 is based on the layout detection model PP-DocLayout_plus-L (built upon the RT-DETR-L model) and cascades a lightweight pointer network with 6 Transformer layers. The PP-DocLayout_plus-L component continues to perform layout detection, identifying different elements in document images (such as text, charts, images, formulas, paragraphs, abstracts, references, etc.), classifying them into predefined categories, and determining their positions within the document. The detected bounding boxes and class labels are then fed into the subsequent pointer network to sort the layout elements and obtain the correct reading order.
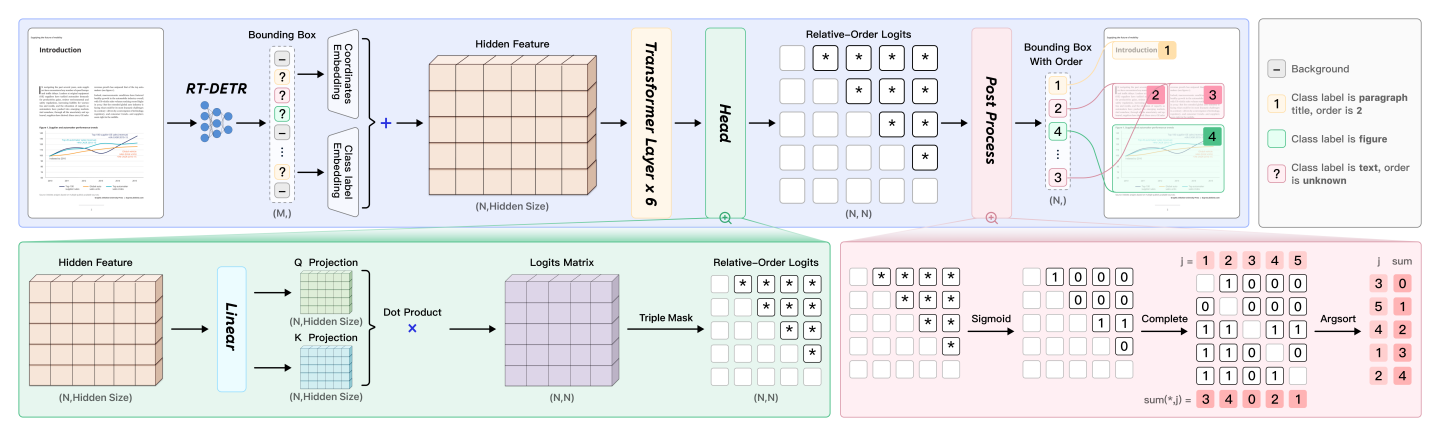
As shown in the figure above, PP-DocLayoutV2 embeds the targets detected by RT-DETR using absolute 2D positional encoding and class labels. Additionally, the pointer network’s attention mechanism incorporates the geometric bias mechanism from Relation-DETR to explicitly model pairwise geometric relationships between elements. The pairwise relation head linearly projects element representations into query and key vectors, then computes bilinear similarities to generate pairwise logits, ultimately producing an N×N matrix representing the relative order between every pair of elements. Finally, a deterministic "win-accumulation" decoding algorithm restores a topologically consistent reading order for the detected layout elements.
The following table only presents the layout detection accuracy of PP-DocLayoutV2. The evaluation dataset is a self-built layout region detection dataset, containing 1,000 images of various document types such as Chinese and English papers, magazines, newspapers, research reports, PPTs, exam papers, textbooks, etc., and covering 25 common layout element categories: document title, section header, text, vertical text, page number, abstract, table of contents, references, footnote, image caption, header, footer, header image, footer image, algorithm, inline formula, display formula, formula number, image, table, figure title (figure title, table title, chart title), seal, chart, aside text, and reference content.
The inference time only includes the model inference time and does not include the time for pre- or post-processing. The "Standard" values correspond to the local
paddle_staticinference engine.
| Model | Model Download Link | mAP(0.5) (%) | GPU Inference Time (ms) [Standard / High-Performance Mode] |
CPU Inference Time (ms) [Standard / High-Performance Mode] |
Model Size (MB) | Description |
|---|---|---|---|---|---|---|
| PP-DocLayoutV2 | Inference Model | 81.4 | - | - | 203.8 | In-house layout analysis model trained on a diverse self-built dataset including Chinese and English academic papers, multi-column magazines, newspapers, PPTs, contracts, books, exam papers, research reports, ancient books, Japanese documents, and vertical text documents. Provides high-precision layout region localization and reading order recovery. |
3. Quick Integration 
❗ Before quick integration, please install the PaddleOCR wheel package. For detailed instructions, refer to PaddleOCR Local Installation Tutorial。
You can quickly try it out with a single command:
paddleocr layout_detection -i https://paddle-model-ecology.bj.bcebos.com/paddlex/imgs/demo_image/layout.jpg --model_name PP-DocLayoutV3
The example above uses the paddle_static inference engine by default. To run it, first install PaddlePaddle by following PaddlePaddle Framework Installation.
If you choose transformers as the inference engine, make sure the Transformers environment is configured, and then run the following command:
paddleocr layout_detection -i https://paddle-model-ecology.bj.bcebos.com/paddlex/imgs/demo_image/layout.jpg --model_name PP-DocLayoutV3 \
    --engine transformers
If you choose onnxruntime as the inference engine, make sure the ONNX Runtime environment is configured, and then run the following command:
paddleocr layout_detection -i https://paddle-model-ecology.bj.bcebos.com/paddlex/imgs/demo_image/layout.jpg --model_name PP-DocLayoutV3 \
    --engine onnxruntime
In most scenarios, the default paddle_static inference engine delivers better inference performance and is the recommended first choice.
Note: The official models would be download from HuggingFace by default. If can't access to HuggingFace, please set the environment variable PADDLE_PDX_MODEL_SOURCE="BOS" to change the model source to BOS. In the future, more model sources will be supported.
You can also integrate the model inference from the layout area detection module into your project. Before running the following code, please download Example Image Go to the local area.
from paddleocr import LayoutDetection

model = LayoutDetection(model_name="PP-DocLayoutV2")
output = model.predict("layout.jpg", batch_size=1, layout_nms=True)
for res in output:
    res.print()
    res.save_to_img(save_path="./output/")
    res.save_to_json(save_path="./output/res.json")
The example above uses the paddle_static inference engine by default. To run it, first install PaddlePaddle by following PaddlePaddle Framework Installation.
If you choose transformers as the inference engine, make sure the Transformers environment is configured, and then run the following code:
from paddleocr import LayoutDetection

model = LayoutDetection(
    model_name="PP-DocLayoutV2",
    engine="transformers",
)
output = model.predict("layout.jpg", batch_size=1, layout_nms=True)
for res in output:
    res.print()
    res.save_to_img(save_path="./output/")
    res.save_to_json(save_path="./output/res.json")
If you choose onnxruntime as the inference engine, make sure the ONNX Runtime environment is configured, and then run the following code:
from paddleocr import LayoutDetection

model = LayoutDetection(
    model_name="PP-DocLayoutV2",
    engine="onnxruntime",
)
output = model.predict("layout.jpg", batch_size=1, layout_nms=True)
for res in output:
    res.print()
    res.save_to_img(save_path="./output/")
    res.save_to_json(save_path="./output/res.json")
In most scenarios, the default paddle_static inference engine delivers better inference performance and is the recommended first choice.
If you want to use the trained model with the paddle_dynamic or transformers engine, refer to the Weight Conversion section in the Inference Engine section below to convert the model from the pdparams format to the safetensors format using PaddleX.
After running, the result obtained is:
{'res': {'input_path': 'layout.jpg', 'page_index': None, 'boxes': [{'cls_id': 7, 'label': 'figure_title', 'score': 0.9764086604118347, 'coordinate': [34.227077, 19.217348, 362.48834, 80.243195]}, {'cls_id': 21, 'label': 'table', 'score': 0.9881672263145447, 'coordinate': [73.759026, 105.72034, 322.67398, 298.82642]}, {'cls_id': 17, 'label': 'paragraph_title', 'score': 0.9405199885368347, 'coordinate': [35.089825, 330.67575, 144.06467, 346.7406]}, {'cls_id': 22, 'label': 'text', 'score': 0.9889925122261047, 'coordinate': [33.540825, 349.37204, 363.5848, 615.04504]}, {'cls_id': 17, 'label': 'paragraph_title', 'score': 0.9430180788040161, 'coordinate': [35.032074, 627.2185, 188.24695, 643.66693]}, {'cls_id': 22, 'label': 'text', 'score': 0.988863468170166, 'coordinate': [33.72388, 646.5885, 363.05005, 852.60236]}, {'cls_id': 7, 'label': 'figure_title', 'score': 0.9749509692192078, 'coordinate': [385.14465, 19.341825, 715.4594, 78.739395]}, {'cls_id': 21, 'label': 'table', 'score': 0.9876241683959961, 'coordinate': [436.68512, 105.67539, 664.1041, 314.0018]}, {'cls_id': 22, 'label': 'text', 'score': 0.9878363013267517, 'coordinate': [385.06494, 345.74847, 715.173, 463.18677]}, {'cls_id': 17, 'label': 'paragraph_title', 'score': 0.951842725276947, 'coordinate': [386.3095, 476.34277, 703.0732, 493.00302]}, {'cls_id': 22, 'label': 'text', 'score': 0.9884033799171448, 'coordinate': [385.1237, 496.70123, 716.09717, 702.33386]}, {'cls_id': 17, 'label': 'paragraph_title', 'score': 0.940105676651001, 'coordinate': [386.66754, 715.5732, 527.5737, 731.77826]}, {'cls_id': 22, 'label': 'text', 'score': 0.9876392483711243, 'coordinate': [384.9688, 734.457, 715.63086, 853.71]}]}}
The meanings of the parameters are as follows:
input_path:The path to the input image for prediction.page_index:If the input is a PDF file, it indicates which page of the PDF it is; otherwise, it isNone.boxes:Predicted layout element information sorted in reading order, represented as a list of dictionaries. According to the reading order, each dictionary represents a detected layout element and contains the following information:cls_id:Class ID, an integer.label:Class label, a string.score:Confidence score of the bounding box, a float.coordinate:Coordinates of the bounding box, a list of floats in the format[xmin, ymin, xmax, ymax]
Relevant methods, parameters, and explanations are as follows:
| Parameter | Description | Type | Default |
|---|---|---|---|
model_name |
Meaning: Model name. Description: If set to None, PP-DocLayout-L will be used. |
str|None |
None |
model_dir |
Meaning:Model storage path. | str|None |
None |
device |
Meaning: Device for inference. Description: If set to None, "cpu" will be used. For example: "cpu", "gpu", "npu", "gpu:0", "gpu:0,1".If multiple devices are specified, parallel inference will be performed. By default, GPU 0 is used if available; otherwise, CPU is used. |
str|None |
None |
engine |
Meaning: Inference engine. Description: Supports None (the default), paddle, paddle_static, paddle_dynamic, transformers, and onnxruntime. When left as None, local inference uses the paddle_static engine by default. For detailed descriptions, supported values, compatibility rules, and examples, see Inference Engine and Configuration. |
str|None |
None |
engine_config |
Meaning: Inference-engine configuration. Description: Recommended together with engine. For supported fields, compatibility rules, and examples, see Inference Engine and Configuration. |
dict|None |
None |
enable_hpi |
Meaning:Whether to enable high-performance inference. | bool |
False |
use_tensorrt |
Meaning:Whether to use the Paddle Inference TensorRT subgraph engine. Description: If the model does not support acceleration through TensorRT, setting this flag will not enable acceleration. For Paddle with CUDA version 11.8, the compatible TensorRT version is 8.x (x>=6), and it is recommended to install TensorRT 8.6.1.6. |
bool |
False |
precision |
Meaning:Computation precision when using the TensorRT subgraph engine in Paddle Inference. Description: Options: "fp32", "fp16". |
str |
"fp32" |
enable_mkldnn |
Meaning:Whether to enable MKL-DNN acceleration for inference. Description: If MKL-DNN is unavailable or the model does not support it, acceleration will not be used even if this flag is set. |
bool |
True |
mkldnn_cache_capacity |
Meaning:MKL-DNN cache capacity. | int |
10 |
cpu_threads |
Meaning:Number of threads to use for inference on CPUs. | int |
10 |
img_size |
Meaning:Input image size. Description:
|
int|list|None |
None |
threshold |
Meaning:Threshold for filtering low-confidence predictions. Description:
|
float|dict|None |
None |
layout_nms |
Meaning:Whether to use NMS post-processing to filter overlapping boxes. Description:
|
bool|None |
None |
layout_unclip_ratio |
Meaning:Scaling factor for the side length of the detection box. Description:
|
float|list|dict|None |
None |
layout_merge_bboxes_mode |
Meaning:Merge mode for model output bounding boxes. Description:
|
str|dict|None |
None |
- The
predict()method of the target detection model is called for inference prediction. The parameters of thepredict()method areinput,batch_size, andthreshold, which are explained as follows:
| Parameter | Description | Type | Default |
|---|---|---|---|
input |
Meaning:Input data to be predicted. Required. Description: Supports multiple input types:
|
Python Var|str|list |
|
batch_size |
Meaning:Batch size Description: Positive integer. |
int |
1 |
threshold |
Meaning:Same meaning as the instantiation parameters. Description: If set to None, the instantiation value is used; otherwise, this parameter takes precedence. |
float|dict|None |
None |
layout_nms |
Meaning:Same meaning as the instantiation parameters. Description: If set to None, the instantiation value is used; otherwise, this parameter takes precedence. |
bool|None |
None |
layout_unclip_ratio |
Meaning:Same meaning as the instantiation parameters. Description: If set to None, the instantiation value is used; otherwise, this parameter takes precedence. |
float|list|dict|None |
None |
layout_merge_bboxes_mode |
Meaning:Same meaning as the instantiation parameters. Description: If set to None, the instantiation value is used; otherwise, this parameter takes precedence. |
str|dict|None |
None |
- Process the prediction results, with each sample's prediction result being the corresponding Result object, and supporting operations such as printing, saving as an image, and saving as a
jsonfile:
| Method | Method Description | Parameters | Parameter type | Parameter Description | Default value |
|---|---|---|---|---|---|
print() |
Print the result to the terminal | format_json |
bool |
Do you want to use JSON indentation formatting for the output content |
True |
indent |
int |
Specify the indentation level to enhance the readability of the JSON data output, only valid when format_json is True |
4 | ||
ensure_ascii |
bool |
Control whether to escape non ASCII characters to Unicode characters. When set to True, all non ASCII characters will be escaped; False preserves the original characters and is only valid when format_json is True |
False |
||
save_to_json() |
Save the result as a JSON format file | save_path |
str |
The saved file path, when it is a directory, the name of the saved file is consistent with the name of the input file type | None |
indent |
int |
Specify the indentation level to enhance the readability of the JSON data output, only valid when format_json is True |
4 | ||
ensure_ascii |
bool |
Control whether to escape non ASCII characters to Unicode characters. When set to True, all non ASCII characters will be escaped; False preserves the original characters and is only valid whenformat_json is True |
False |
||
save_to_img() |
Save the results as an image format file | save_path |
str |
The saved file path, when it is a directory, the name of the saved file is consistent with the name of the input file type | None |
- Additionally, it also supports obtaining the visualized image with results and the prediction results via attributes, as follows:
| Attribute | Description |
|---|---|
json |
Get the prediction result in json format |
img |
Get the visualized image in dict format |
4. Inference Engine
For detailed descriptions, values, compatibility rules, and examples of the inference engine, please refer to Inference Engine and Configuration Description.
4.1 Speed Data
| model | engine | Preprocessing (ms) | Inference (ms) | PostProcessing (ms) | End-to-End (ms) |
|---|---|---|---|---|---|
| PP-DocLayoutV3 | paddle_static | 10.95 | 47.99 | 12.97 | 72.33 |
| paddle_dynamic | 11.33 | 84.48 | 1.31 | 98.01 | |
| transformers | 16.94 | 47.11 | 13.83 | 78.97 | |
| onnxruntime | 9.26 | 39.11 | 10.23 | 58.80 | |
| PP-DocLayoutV2 | paddle_static | 10.48 | 30.94 | 1.33 | 42.93 |
| paddle_dynamic | 11.07 | 86.38 | 1.33 | 99.80 | |
| transformers | 16.76 | 49.08 | 2.43 | 69.30 | |
| onnxruntime | 9.25 | 15.13 | 1.25 | 25.82 |
Test Environment Description:
- Test Data: Sample Image
- Hardware Configuration:
- GPU: NVIDIA A100 40G
- CPU: Intel(R) Xeon(R) Gold 6248 CPU @ 2.50GHz
- Software Environment:
- Ubuntu 22.04 / CUDA 12.6 / cuDNN 9.5
- paddlepaddle-gpu 3.2.1 / paddleocr 3.5 / transformers 5.4.0 / torch 2.10 / onnxruntime-gpu 1.23.2
4.2 Weight Conversion
When using the inference engine, the system will automatically download the official pre-trained model. If you need to use a self-trained model with the paddle_dynamic or transformers engine, please refer to the PaddleX Layout Analysis Module Weight Conversion section to convert the model from the pdparams format to the safetensors format using PaddleX. This allows seamless integration into the PaddleOCR API for inference. If you need to use a self-trained model with the onnxruntime engine, refer to PaddleX Obtain ONNX Models to obtain the ONNX model, so it can be seamlessly integrated into the PaddleOCR API for inference.